How AI is shaking up the study of earthquakes
“It's kind of like putting on glasses for the first time,” one scientist told me.
On January 1, 2008, at 1:59 AM in Calipatria, California, an earthquake happened. You haven’t heard of this earthquake; even if you had been living in Calipatria, you wouldn’t have felt anything. It was magnitude -0.53, about the same amount of shaking as a truck passing by. Still, this earthquake is notable: not because it was large, but because it was small and yet we know about it.
Over the past seven years, AI tools based on computer imaging have almost completely automated one of the fundamental tasks of seismology: detecting earthquakes. What used to be the task of human analysts and later, simpler computer programs, can now be done automatically and quickly by machine learning tools.
These machine learning tools can detect smaller earthquakes than human analysts, especially in noisy environments like cities. Earthquakes give valuable information about the composition of the Earth and what hazards might occur in the future.
“In the best-case scenario, when you adopt these new techniques, even on the same old data, it’s kind of like putting on glasses for the first time, and you can see the leaves on the trees,” said Kyle Bradley, co-author of the Earthquake Insights newsletter.
I talked with several earthquake scientists, and they all agreed that machine learning methods have replaced humans for the better in these specific tasks.
“It’s really remarkable,” Judith Hubbard, a Cornell professor and Bradley’s co-author, told me.
Less certain is what comes next. Earthquake detection is a fundamental part of seismology, but there are many other data processing tasks that have yet to be disrupted. The biggest potential impacts, all the way to earthquake forecasting, haven’t materialized yet.
“It really was a revolution,” said Joe Byrnes, a professor at the University of Texas at Dallas. “But the revolution is ongoing.”
What do seismologists do?
When an earthquake happens in one place, the shaking passes through the ground similar to how sound waves pass through the air. In both cases, it’s possible to draw inferences about the materials the waves pass through.
Imagine tapping a wall to figure out if it’s hollow. Because a solid wall vibrates differently than a hollow wall, you can figure out the structure by sound.
With earthquakes, this same principle holds. Seismic waves pass through different materials (rock, oil, magma, etc.) differently, and scientists use these vibrations to image the Earth’s interior.
The main tool that scientists traditionally use is a seismometer. These record the movement of the Earth in three directions: up–down, north–south, and east–west. If an earthquake happens, seismometers can measure the shaking in that particular location.
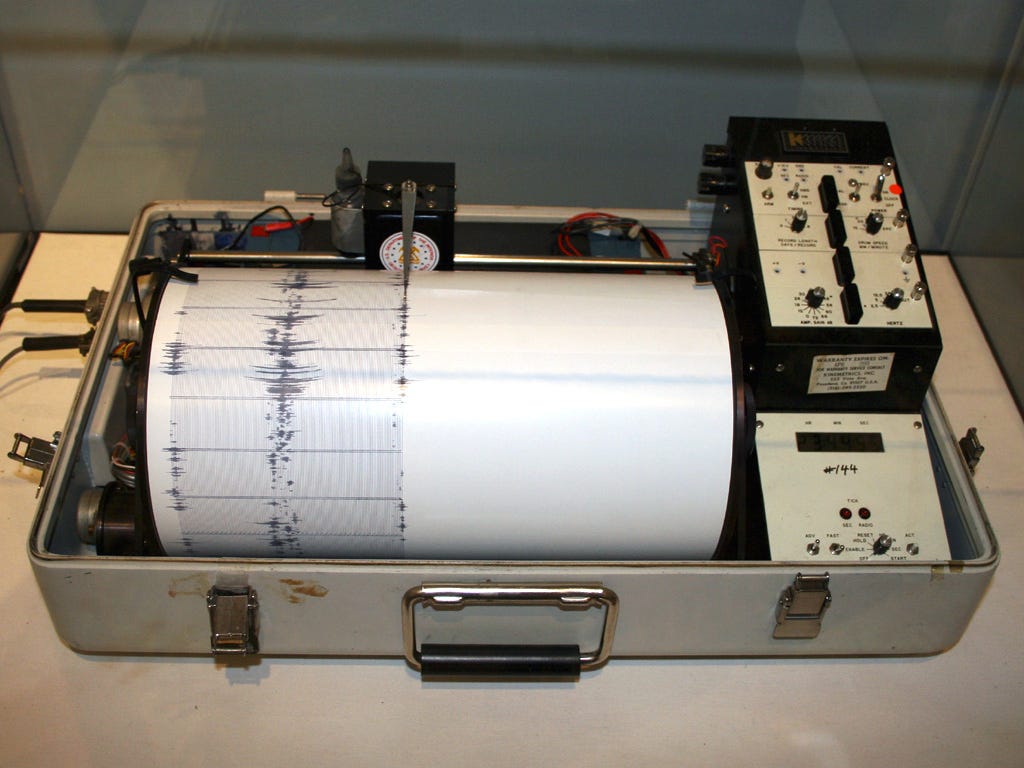
Scientists then process raw seismometer information to identify earthquakes.
Earthquakes produce multiple types of shaking, which travel at different speeds. Two types, Primary (P) waves and Secondary (S) waves are particularly important, and scientists like to identify the start of each of these phases.
Finding quakes before machine learning
Before good algorithms, earthquake cataloging had to happen by hand. Byrnes said that “traditionally, something like the lab at the United States Geological Survey would have an army of mostly undergraduate students or interns looking at seismograms.”
However, there are only so many earthquakes you can find and classify manually. Creating algorithms to effectively find and process earthquakes has long been a priority in the field — especially since the arrival of computers in the early 1950s.
“The field of seismology historically has always advanced as computing has advanced,” Bradley told me.
There’s a big challenge with traditional algorithms though: they can’t easily find smaller quakes, especially in noisy environments.
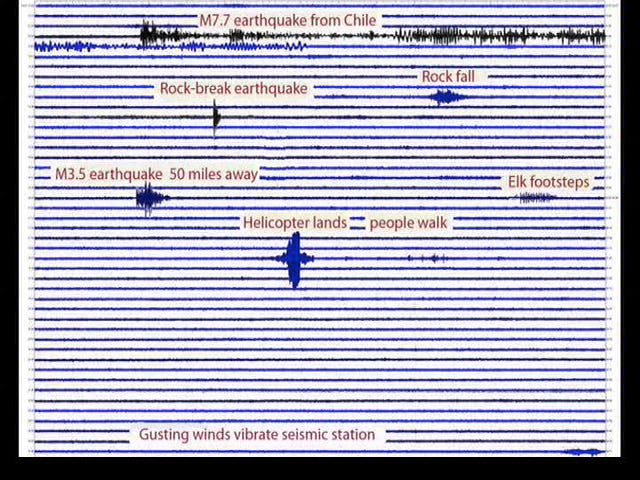
As we see in this seismogram above, many different events can cause seismic signals. If a method is too sensitive, it risks falsely detecting events as earthquakes. The problem is especially bad in cities, where the constant hum of traffic and buildings can drown out small earthquakes.
However, earthquakes have a characteristic “shape.” The magnitude 7.7 earthquake above looks quite different from the helicopter landing, for instance.
So one idea scientists had was to make templates from human-labeled datasets. If a new waveform correlates closely with an existing template, it’s almost certainly an earthquake.
Template matching works very well if you have enough human-labeled examples. In 2019, Zach Ross’s lab at Caltech used template matching to find ten times as many earthquakes in Southern California as had previously been known, including the earthquake at the start of this story. Almost all of the new 1.6 million quakes they found were very small, magnitude 1 and below.
If you don’t have an extensive pre-existing dataset of templates, however, you can’t easily apply template matching. That isn’t a problem in Southern California — which already had a basically complete record of earthquakes down to magnitude 1.7 — but it’s a challenge elsewhere.
Also, template matching is computationally expensive. Creating a Southern California quake dataset using template matching took 200 Nvidia P100 GPUs running for days on end.
There had to be a better way.
Breaking down the Earthquake Transformer
AI detection models solve both these problems:
They are faster than template matching. Because AI detection models are very small (around 350,000 parameters compared to billions in LLMs), they can be run on consumer CPUs.
AI models generalize well to regions not represented in the original dataset.
As an added bonus, AI models can give better information about when the different types of earthquake shaking arrive. Timing the arrivals of the two most important waves — P and S waves — is called phase picking. It allows scientists to draw inferences about the structure of the quake. AI models can do this alongside earthquake detection.
The basic task of earthquake detection (and phase picking) looks like this:
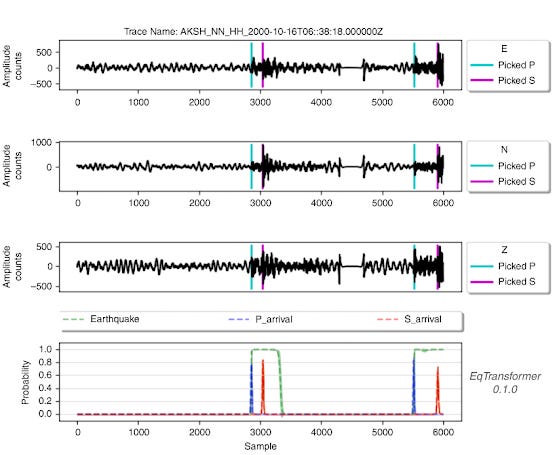
The first three rows represent different directions of vibration (east–west, north–south, and up–down respectively). Given these three dimensions of vibration, can we determine if an earthquake occurred, and if so, when it started?
Ideally, our model outputs three things at every time step in the sample:
The probability that an earthquake is occurring at that moment.
The probability that a P wave arrives at that moment.
The probability that an S wave arrives at that moment.
We see all three outputs in the fourth row: the detection in green, the P wave arrival in blue, and the S wave arrival in red. (There are two earthquakes in this sample).
To train an AI model, scientists take large amounts of labeled data like what’s above and do supervised training. I’ll describe one of the most used models: Earthquake Transformer, which was developed around 2020 by a Stanford team led by S. Mostafa Mousavi — who later became a Harvard professor.
Like many earthquake detection models, Earthquake Transformer adapts ideas from image classification. Readers may be familiar with AlexNet, a famous image recognition model that kicked off the deep learning boom in 2012.
AlexNet used convolutions, a neural network architecture that’s based on the idea that pixels that are physically close together are more likely to be related. The first convolutional layer of AlexNet broke an image down into small chunks — 11 pixels on a side — and classified each chunk based on the presence of simple features like edges or gradients.
The next layer took the first layer’s classifications as input and checked for higher-level concepts such as textures or simple shapes.
Each convolutional layer analyzed a larger portion of the image and operated at a higher level of abstraction. By the final layers, the network was looking at the entire image and identifying objects like “mushroom” and “container ship.”
Images are two-dimensional, so AlexNet is based on two-dimensional convolutions. In contrast, seismograph data is one-dimensional, so Earthquake Transformer uses one-dimensional convolutions over the time dimension. The first layer analyzes vibration data in 0.1-second chunks, while later layers identify patterns over progressively longer time periods.
It’s difficult to say what exact patterns the earthquake model is picking out, but we can analogize this to a hypothetical audio transcription model using one-dimensional convolutions. That model might first identify consonants, then syllables, then words, then sentences over increasing time scales.
Earthquake Transformer converts raw waveform data into a collection of high-level representations that indicate the likelihood of earthquakes and other seismologically significant events. This is followed by a series of deconvolution layers that pinpoint exactly when an earthquake — and its all-important P and S waves — occurred.
The model also uses an attention layer in the middle of the model to mix information between different parts of the time series. The attention mechanism is most famous in large language models, where it helps pass information between words. It plays a similar role in seismographic detection. Earthquake seismograms have a general structure: P waves followed by S waves followed by other types of shaking. So if a segment looks like the start of a P wave, the attention mechanism helps it check that it fits into a broader earthquake pattern.
Scaling earthquake data
All of the Earthquake Transformer’s components are standard designs from the neural network literature. Other successful detection models, like PhaseNet, are even simpler. PhaseNet uses only one-dimensional convolutions to pick the arrival times of earthquake waves. There are no attention layers.
Generally, there hasn’t been “much need to invent new architectures for seismology,” according to Byrnes. The techniques derived from image processing have been sufficient.
What made these generic architectures work so well then? Data. Lots of it.
We’ve previously reported on how the introduction of ImageNet, an image recognition benchmark, helped spark the deep learning boom. Large, publicly available earthquake datasets have played a similar role in seismology.
Earthquake Transformer was trained using the Stanford Earthquake Dataset (STEAD), which contains 1.2 million human-labeled segments of seismogram data from around the world. (The paper for STEAD explicitly mentions ImageNet as an inspiration). Other models, like PhaseNet, were also trained on hundreds of thousands or millions of labeled segments.
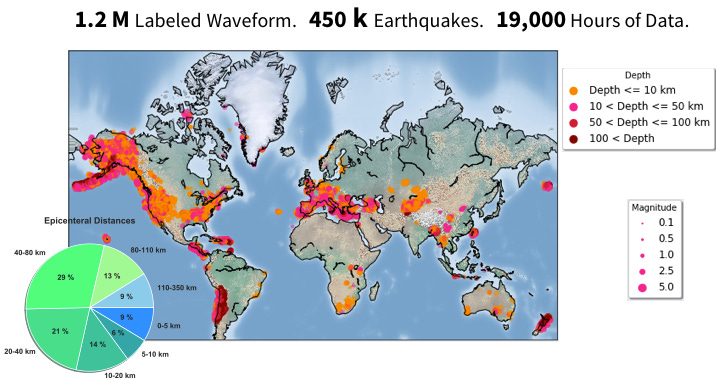
The combination of the data and the architecture just works. The current models are “comically good” at identifying and classifying earthquakes, according to Byrnes. Typically, machine learning methods find ten or more times the quakes that were previously identified in an area. You can see this directly in an Italian earthquake catalog:
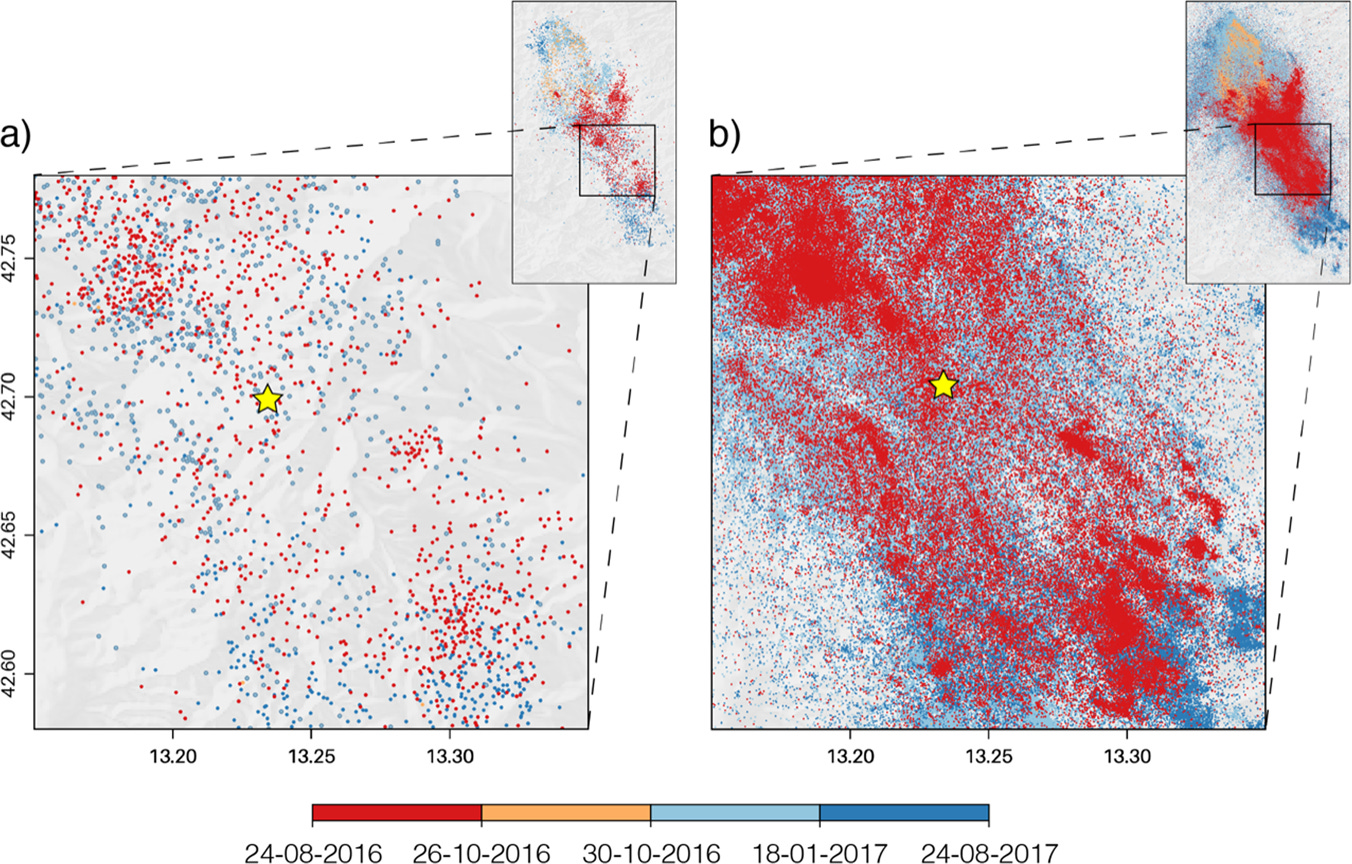
AI tools won’t necessarily detect more earthquakes than template matching. But AI-based techniques are much less compute- and labor-intensive, making them more accessible to the average research project and easier to apply in regions around the world.
All in all, these machine learning models are so good that they’ve almost completely supplanted traditional methods for detecting and phase-picking earthquakes, especially for smaller magnitudes.
What does all this AI stuff do?
The holy grail of earthquake science is earthquake prediction. For instance, scientists know that a large quake will happen near Seattle, but have little ability to know whether it will happen tomorrow or in a hundred years. It would be helpful if we could predict earthquakes precisely enough to allow people in affected areas to evacuate.
You might think AI tools would help predict earthquakes, but that doesn’t seem to have happened yet.
The applications are more technical, and less flashy, said Cornell’s Judith Hubbard.
Better AI models have given seismologists much more comprehensive earthquake catalogs, which have unlocked “a lot of different techniques,” Bradley said.
One of the coolest applications is in understanding and imaging volcanoes. Volcanic activity produces a large number of small earthquakes, whose locations help scientists understand the structure of the magma system. In a 2022 paper, John Wilding and co-authors used a large AI-generated earthquake catalog to create this incredible image of the structure of the Hawaiian volcanic system.
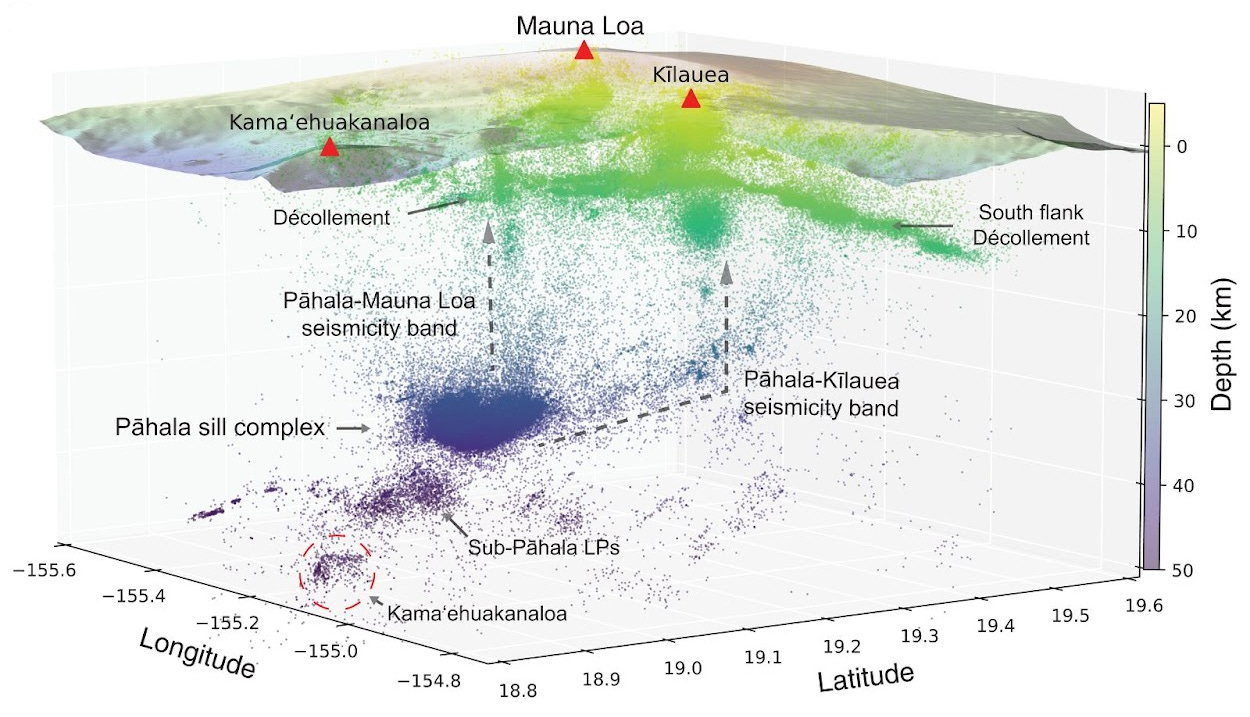
They provided direct evidence of a previously hypothesized magma connection between the deep Pāhala sill complex and Mauna Loa’s shallow volcanic structure. You can see this in the image with the arrow labeled as Pāhala-Mauna Loa seismicity band. The authors were also able to clarify the structure of the Pāhala sill complex into discrete sheets of magma. This level of detail could potentially facilitate better real-time monitoring of earthquakes and more accurate eruption forecasting.
Another promising area is lowering the cost of dealing with huge datasets. Distributed Acoustic Sensing (DAS) is a powerful technique that uses fiber-optic cables to measure seismic activity across the entire length of the cable. A single DAS array can produce “hundreds of gigabytes of data” a day, according to Jiaxuan Li, a professor at the University of Houston. That much data can produce extremely high resolution datasets — enough to pick out individual footsteps.
AI tools make it possible to very accurately time earthquakes in DAS data. Before the introduction of AI techniques for phase picking in DAS data, Li and some of his collaborators attempted to use traditional techniques. While these “work roughly,” they weren’t accurate enough for their downstream analysis. Without AI, much of his work would have been “much harder,” he told me.
Li is also optimistic that AI tools will be able to help him isolate “new types of signals” in the rich DAS data in the future.
Not all AI techniques have paid off
As in many other scientific fields, seismologists face some pressure to adopt AI methods whether or not it’s relevant to their research.
“The schools want you to put the word AI in front of everything,” Byrnes said. “It’s a little out of control.”
This can lead to papers that are technically sound but practically useless. Hubbard and Bradley told me that they’ve seen a lot of papers based on AI techniques that “reveal a fundamental misunderstanding of how earthquakes work.”
They pointed out that graduate students can feel pressure to specialize in AI methods at the cost of learning less about the fundamentals of the scientific field. They fear that if this type of AI-driven research becomes entrenched, older methods will get “out-competed by a kind of meaninglessness.”
While these are real issues, and ones Understanding AI has reported on before, I don’t think they detract from the success of AI earthquake detection. In the last five years, an AI-based workflow has almost completely replaced one of the fundamental tasks in seismology for the better.
That’s pretty cool.


This is the content I did not know I wanted. Very interesting read.
Having grown up in California I have a sort of visceral interest in earthquakes, although I was never tempted to study geophysics. (Beyond learning that "P waves" are pressure waves and "S waves," shear waves.) But many decades ago my career was transformed when I took a short course from John Tukey on FFT — the technique that made matched filtering a widely-practical technique. So it's fascinating to see how ML can get the same results so much more efficiently. It's not obvious to me, though, that ML models can provide the same sort of insight into underlying mechanisms that matched filtering often does.